Build an internet-of-things dashboard with Google Sheets and RStudio Shiny: Tutorial Series.
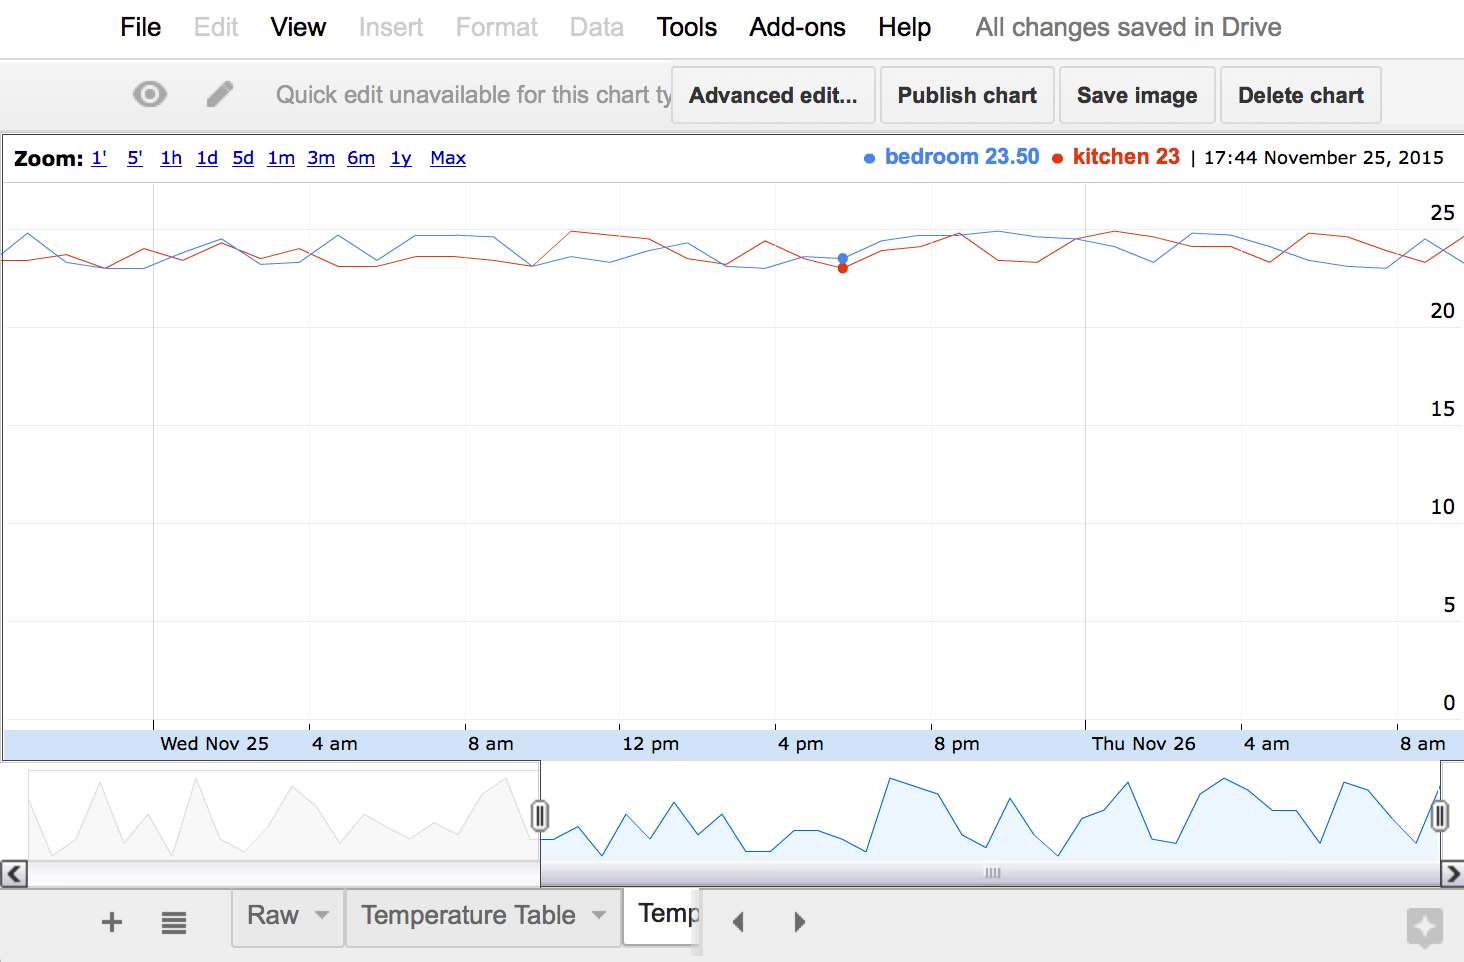
Dec 27, 2015 · 2 minute read · CommentsLogging data to a central server and displaying it online is a common task in Internet of Things applications. This usually requires deploying and maintaining your own servers, with a database for storage and a web server for display. System administration tasks are no fun to me, so instead I found a way to use Google Sheets as a server, and ShinyApps.io as a visualization platform. Uploading data to Google docs is relatively simple and well documented, but connecting Shiny to Google Docs was a little more tricky; this motivated me to write this tutorial to show others how to set up a similar system.
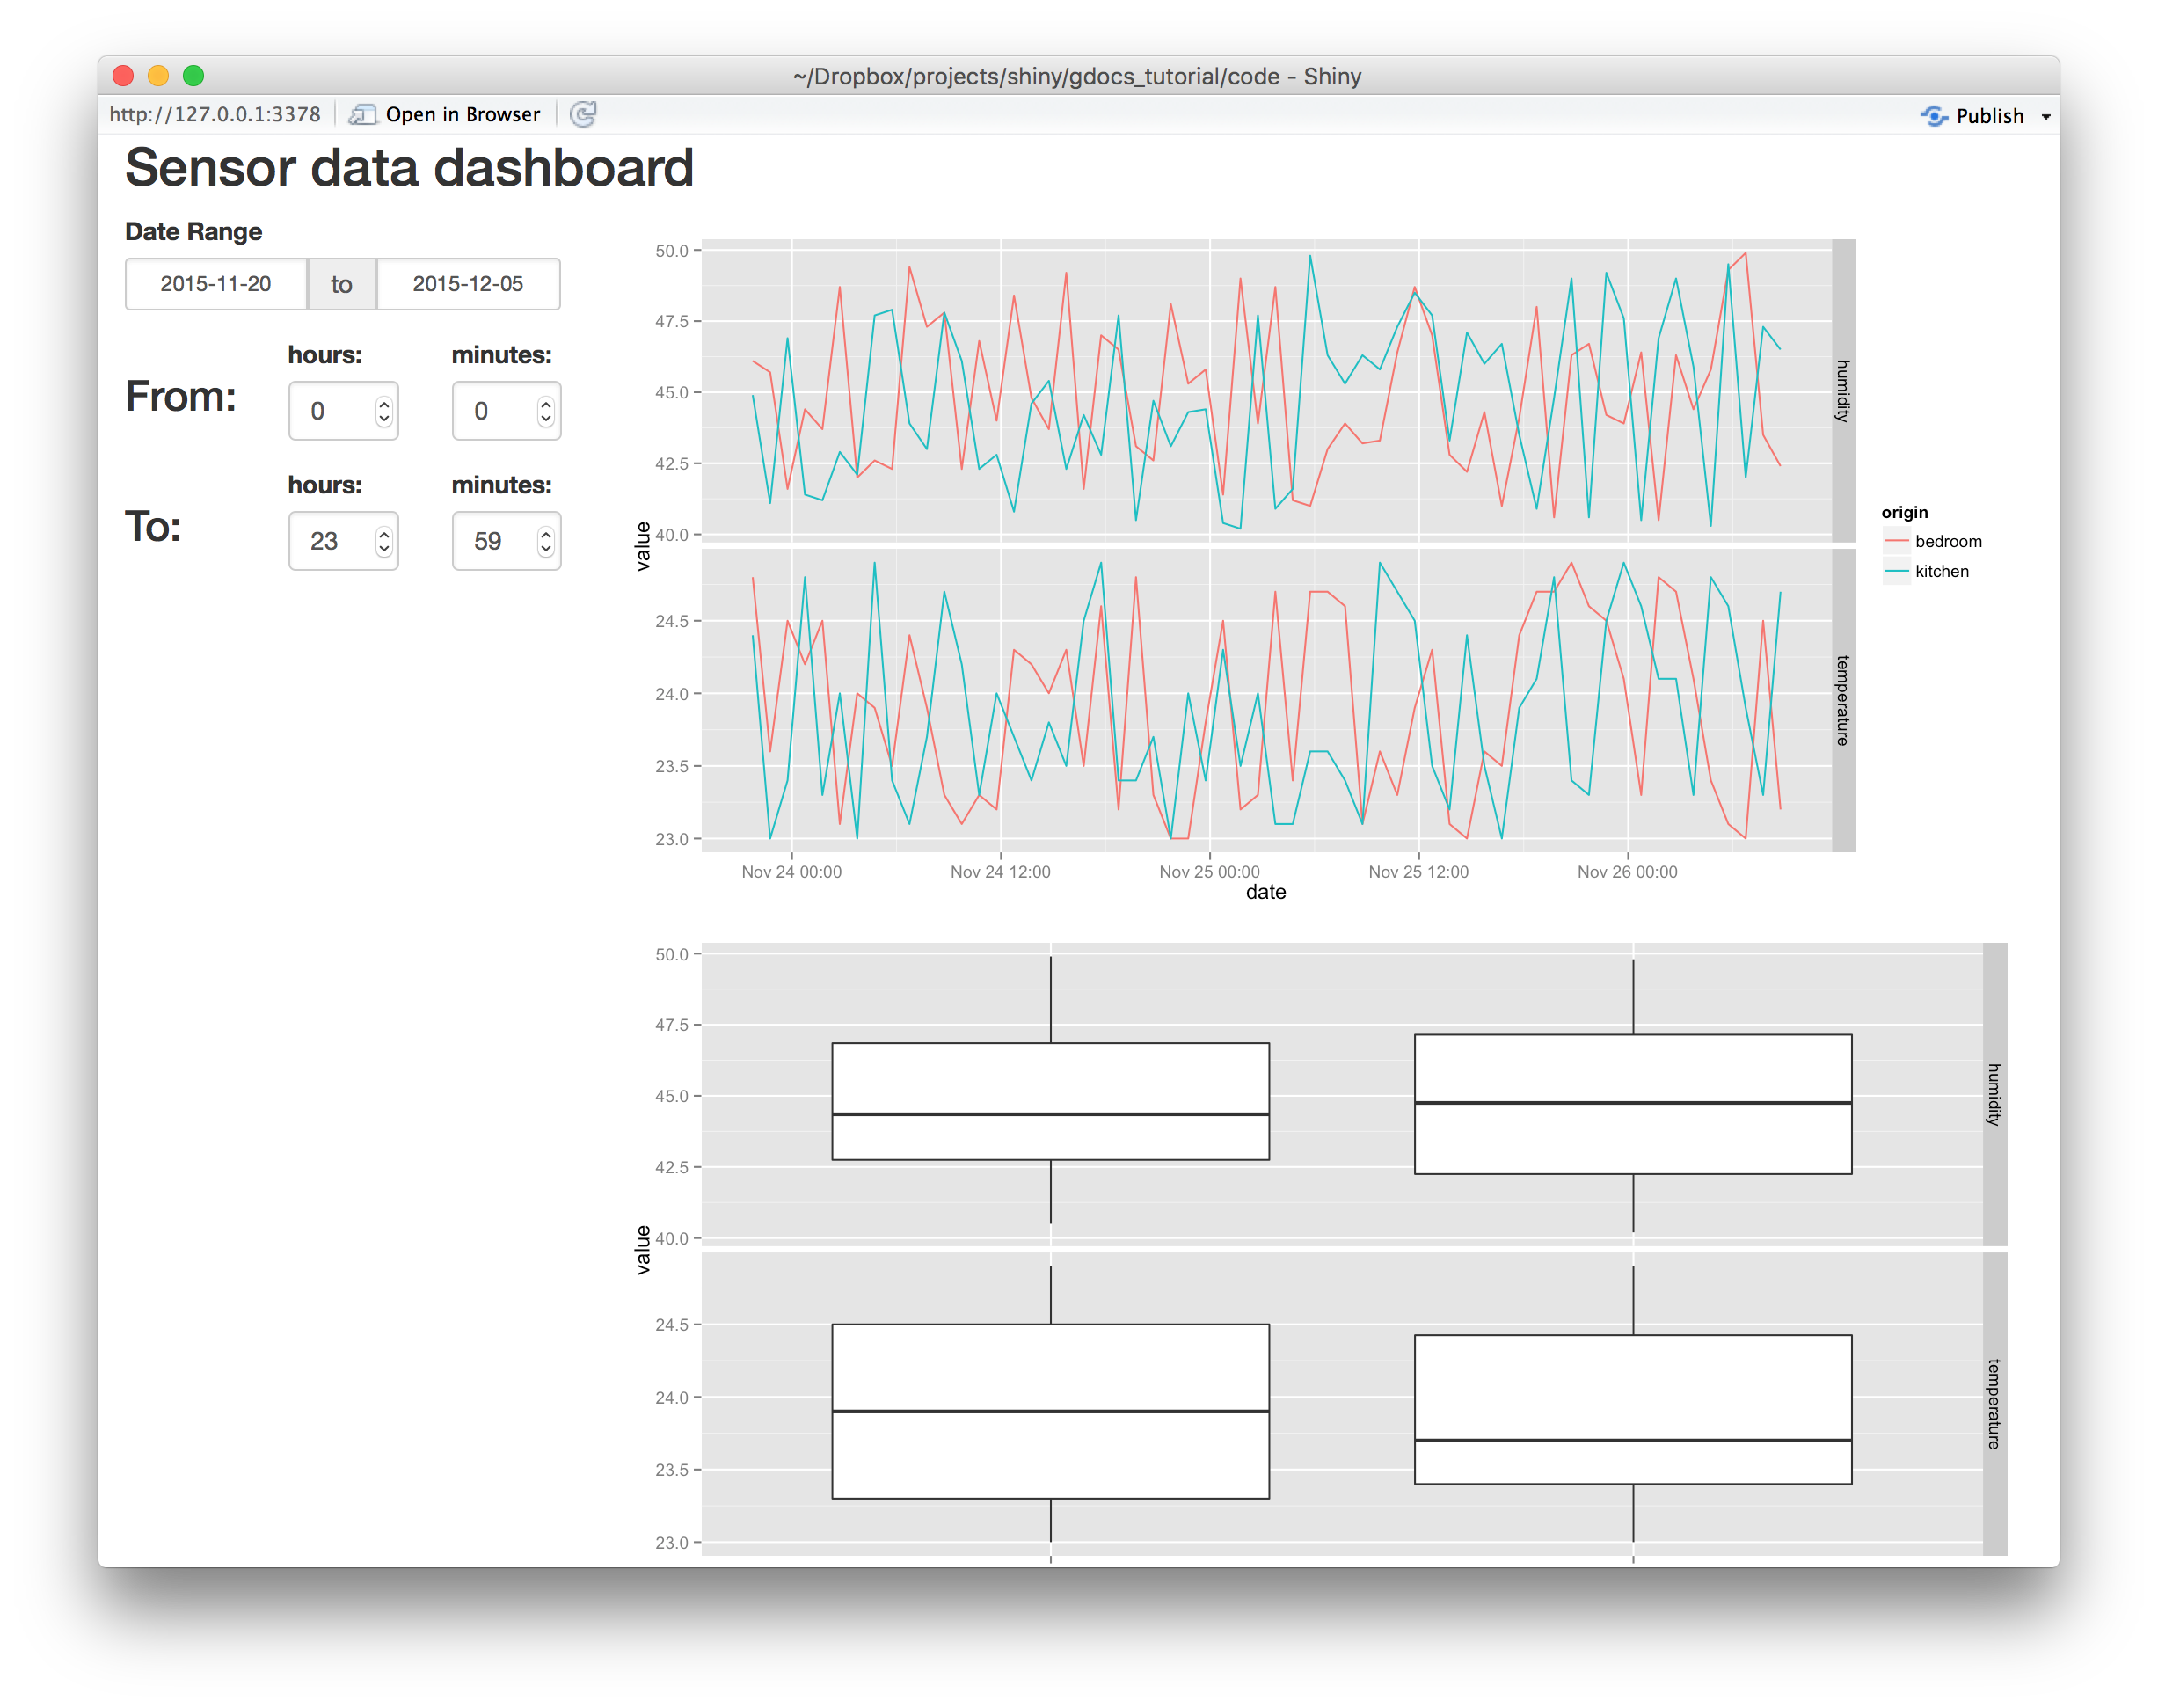
In part one, I’ll explain how to set up a Google spreadsheet as data storage and use it as an elementary dashboard. In part two, I’ll teach you how to retrieve that data in R, and plot it with the ggplot2 library. In part three, I’ll walk you through making a simple interactive visualization in Shiny and publishing it online to ShinyApps.io.
During the tutorial, we’ll pretend to have a network of several temperature and humidity sensors. Each sensor is named after its location name (such as “bedroom” or “living room”), and records the temperature every hour. I assume you know how to program your IOT hardware to make HTTP requests; for the sake of the tutorial I provide a Python script to upload fake temperature and humidity values.
This tutorial series has kindly been translated to Chinese by Harry Zhu: https://segmentfault.com/a/1190000004426828
Why use Google Sheets?
Google spreadsheets can serve as a simple server to store and retrieve data, while writing surprisingly little code. We avoid maintaining our own servers, and we additionally benefit from easy access to the raw data. On top of that, the spreadsheets on their own are powerful analysis tools, with statistics, pivot tables, filters, and interactive charts which can be embedded on external websites.
Why use R and Shiny?
R is a powerful language specifically designed for data analysis. Combined with the ggplot2 graphing library, it provides an ideal package to explore and visualize large amounts data. Once you have figured out what you want to show, Shiny allows you to take your visualizations, make them interactive, and publish them on the web. RStudio, the makers of Shiny, even provide free hosting for visualizations, which makes the service quite convenient to experiment with.