Build an internet-of-things dashboard with Google Sheets and RStudio Shiny: Tutorial part 1/3
Dec 27, 2015 · 11 minute read · CommentsIn part one of this tutorial, you will learn how to script a Google Sheet to store data from your hardware using an HTTP POST request and to retrieve the sheet’s data using an HTTP GET requests. Along the way, you will also experiment with some of the spreadsheet’s built-in analytics tools: filters, pivot tables, and charts.
Skip to part 2 to learn how to fetch and manipulate this data in R, or part 3 to learn how to use Shiny.
Chinese translation: https://segmentfault.com/a/1190000004426828
The finished code files are available on Github: https://github.com/douglas-watson/shiny-gdocs
Prelude: data storage format
For each data point logged from the sensors, we will store: a timestamp, the device ID, a variable name (“temperature”, or “humidity”), and finally the value of that reading. This means each reading of the sensor produces two lines: one for temperature and one for humidity. This format is what R users call “long format”. In the example below, we monitor two rooms every three seconds:
| timestamp | ID | variable | value |
|---|---|---|---|
| 1448227096 | kitchen | temperature | 22.3 |
| 1448227096 | kitchen | humidity | 45 |
| 1448227096 | bedroom | temperature | 24.0 |
| 1448227096 | bedroom | humidity | 46 |
| 1448227099 | kitchen | temperature | 22.4 |
| 1448227099 | kitchen | humidity | 45 |
| 1448227099 | bedroom | temperature | 23.9 |
| 1448227099 | bedroom | humidity | 45 |
Contrast this to the “wide” format, where each variable has its own column:
| timestamp | kitchen temperature | kitchen humidity | bedroom temperature | bedroom humidity |
|---|---|---|---|---|
| 1448227096 | 22.3 | 45 | 24.0 | 46 |
| 1448227099 | 22.4 | 45 | 23.9 | 45 |
The wide format is more obvious to work with and more compact, but isn’t easily extensible: if we add a new sensor to our system, we need to add a column to the file. With the long format, we just keep appending new lines. The long format also suits R analysis well and can be transformed into the wide format using a pivot table in a spreadsheet.
Finally, we’ll exchange data in Comma-Separated Values (CSV) format because it is easy to generate from an embedded device, easy to store as a text file, and easy to read in any text editor or spreadsheet application.
Preparing a spreadsheet to receive data
If you don’t have a google drive account, create one. Then:
- Create a new spreadsheet in Google drive
- Rename the first sheet (a sheet is a tab in the document) to “Raw”. This is where the data will be logged to.
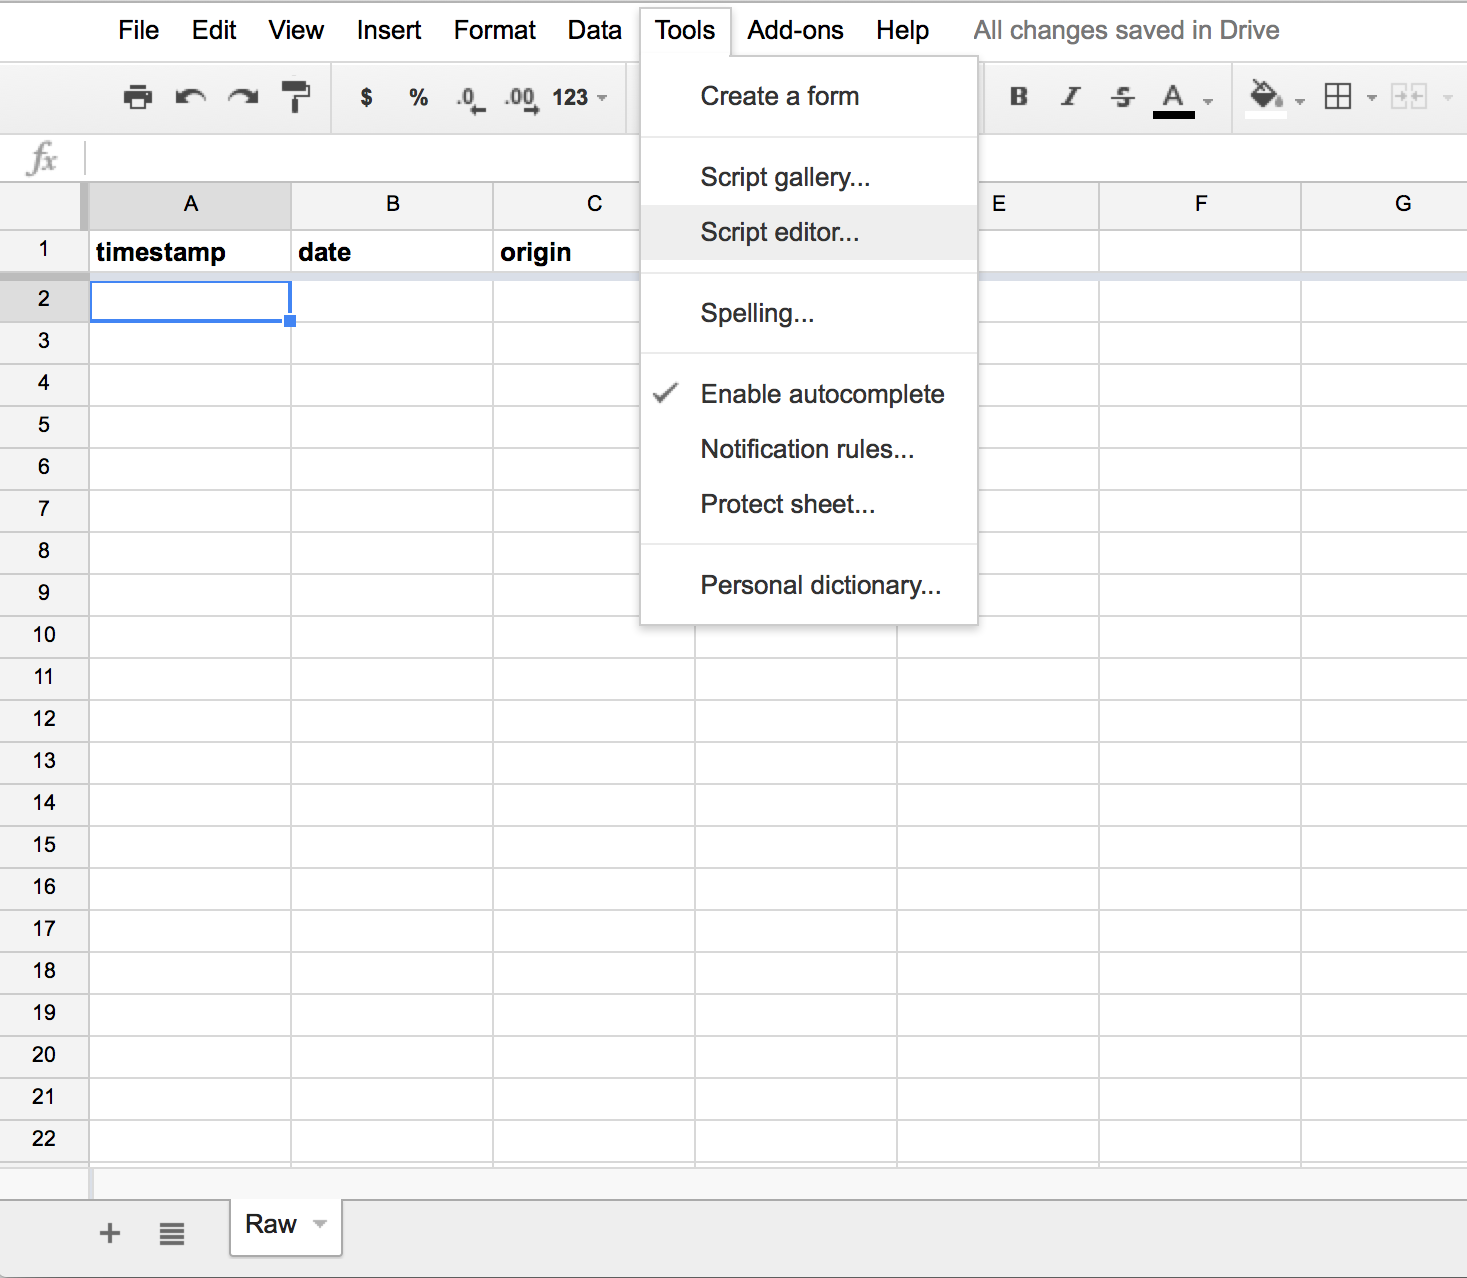
- Create the header row. Each line of data, will have: a unix timestamp (number of seconds since 1 January 1970), a separate column as a human-readable date, then the columns “id”, “variable”, and “value” explained above. You can freeze the row, to keep it visible when scrolling, with “View” > “Freeze” > “1 Row”.
- Open the script editor, in the “Tools” > “Script editor…” menu.
You are now ready to code!
Appending a line from google script
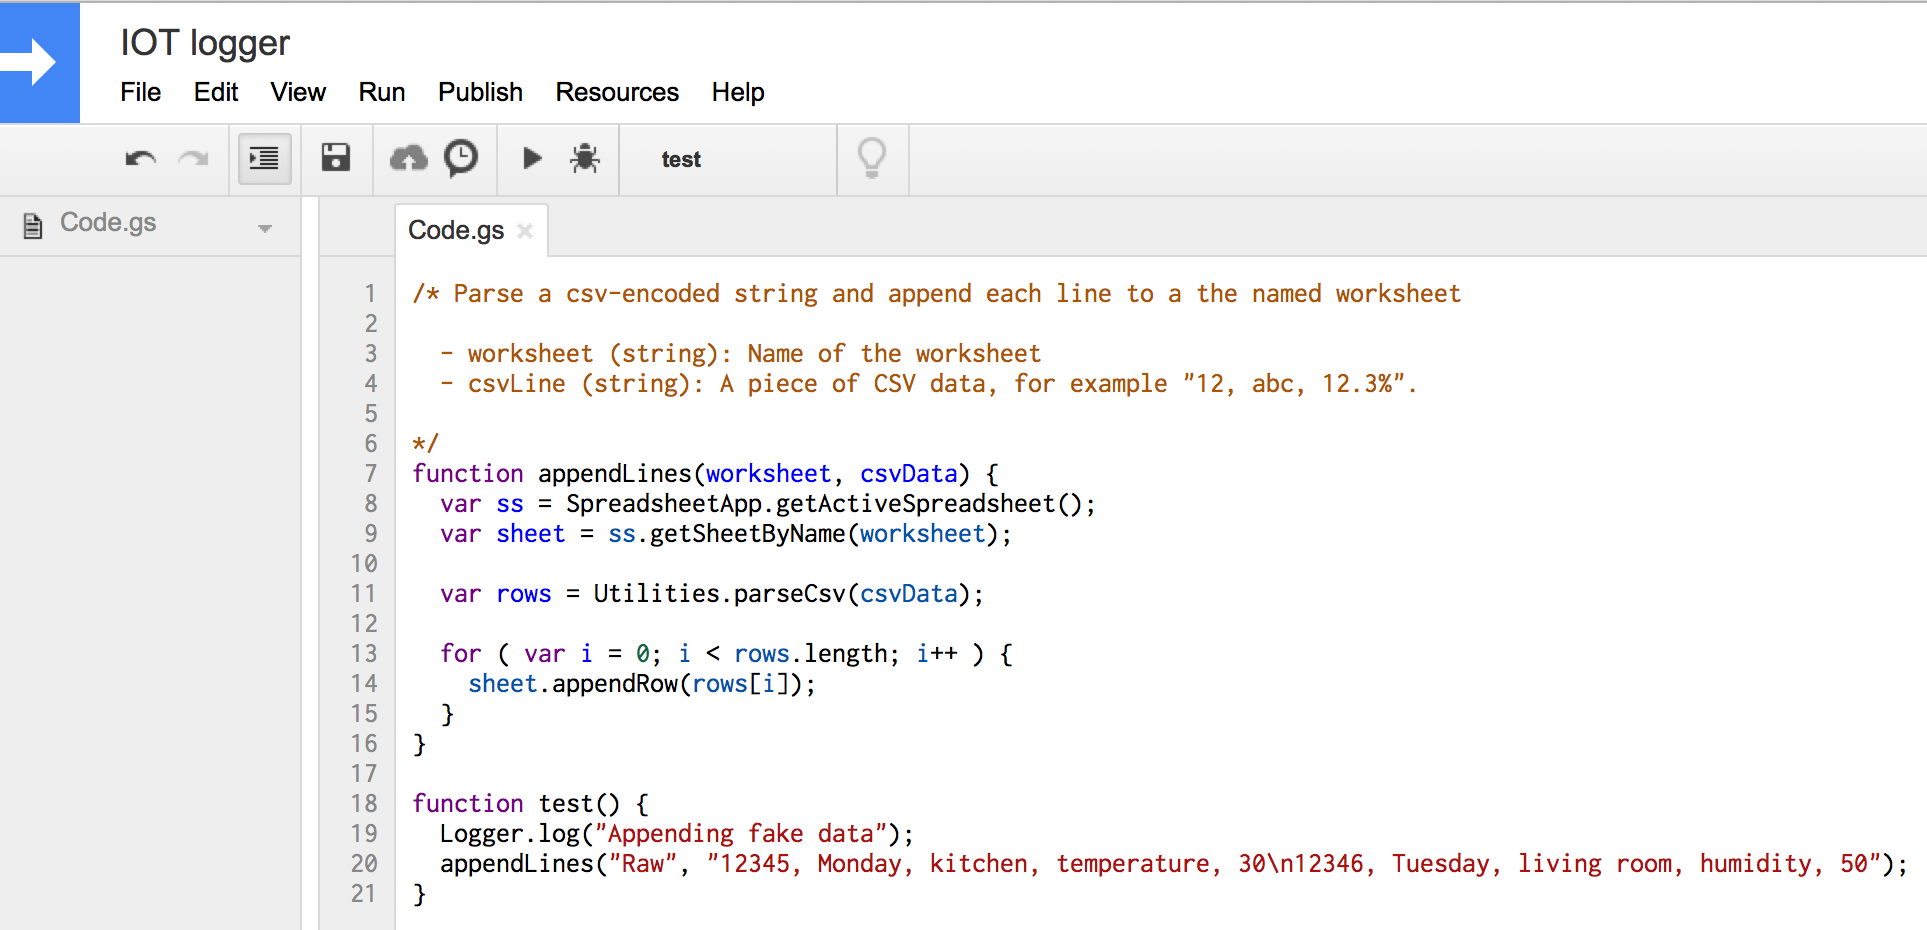
You should now be looking at the script editor. This tool allows you to write custom spreadsheet functions (which are called as=SUM(A1:A5)), and to write simple web applications. Our first step will be to write a function that appends CSV data to the spreadsheet. Copy this code into the script editor:
function appendLines(worksheet, csvData) {
  var ss = SpreadsheetApp.getActiveSpreadsheet();
  var sheet = ss.getSheetByName(worksheet);

  var rows = Utilities.parseCsv(csvData);

  for ( var i = 0; i < rows.length; i++ ) {
    sheet.appendRow(rows[i]);
  }
}

function test() {
  Logger.log("Appending fake data");
  appendLines("Raw", "12345, Monday, kitchen, temperature, 30\n12346, Tuesday, living room, humidity, 50");
}
Our appendLine function does this:
- Open the current spreadsheet (full document);
- select a sheet within the document, as identified by the first argument (we currently only have one, named Raw);
- parse the CSV data given as the second argument;
- for each line in the CSV data, append the line to the sheet.
We additionally wrote a small test function which calls appendLines, to make sure everything works. To run it, select the test function in the toolbar and click the run button. If you are asked to authorize the script, do so. This should have appended two lines to the spreadsheet. You can also view the log output with “View” > “Logs” in the script editor.
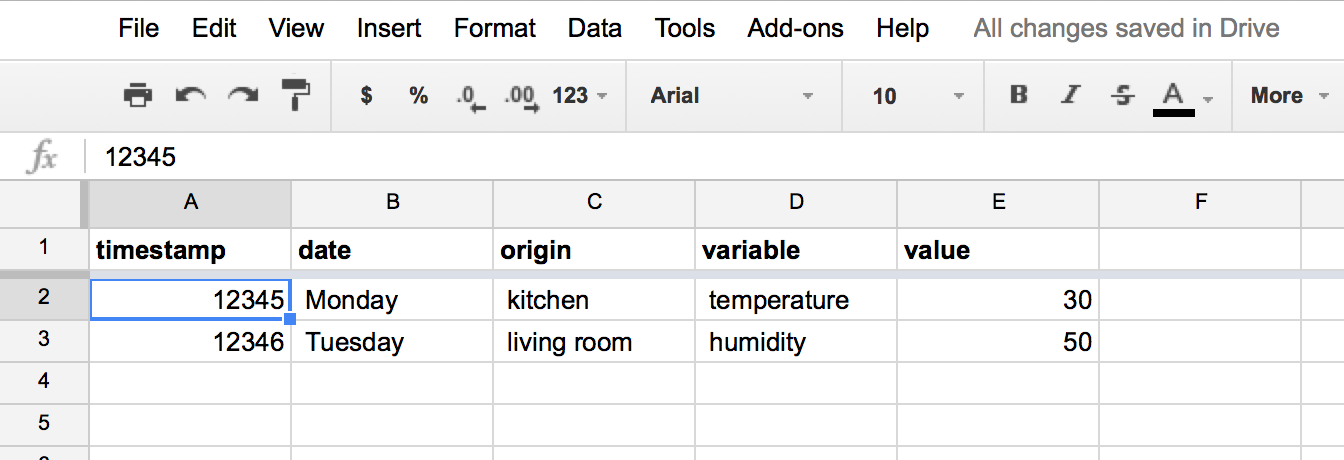
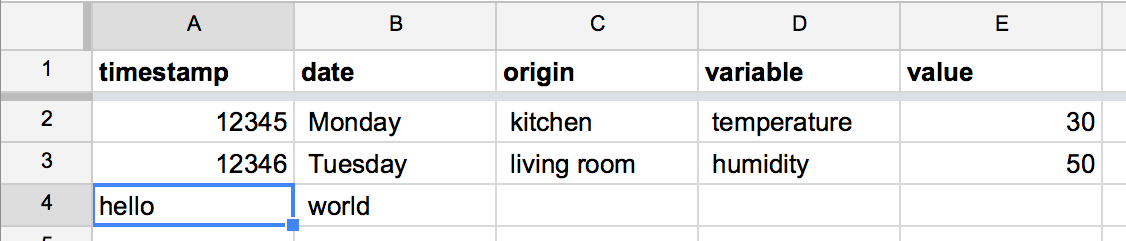
Two lines of data should be added to the spreadsheet:
Our code has a critical flaw, however. Later, when we’ll call it as a web service, the script will have no active spreadsheet associated. We need to change the code to fetch the spreadsheet from its unique ID. Find the document ID in the URL of spreadsheet:
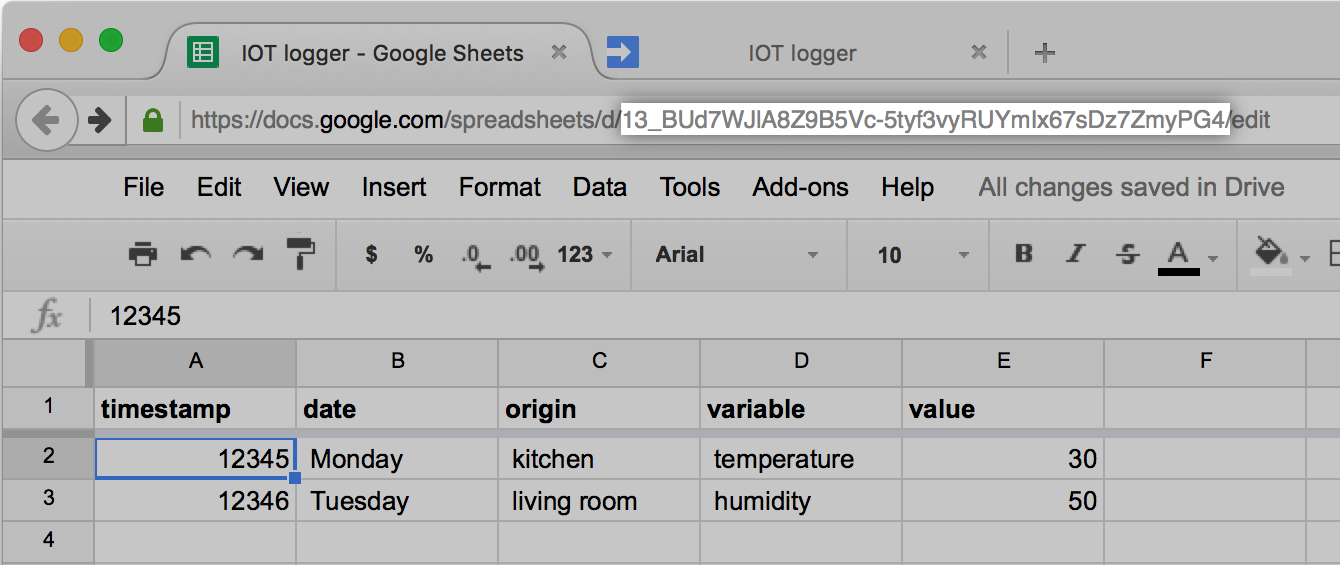
Then modify appendLines to fetch the document by ID:
function appendLines(worksheet, csvData) {
  var ss = SpreadsheetApp.openById("13_BUd7WJlA8Z9B5Vc-5tyf3vyRUYmIx67sDz7ZmyPG4");
  var sheet = ss.getSheetByName(worksheet);

  var rows = Utilities.parseCsv(csvData);

  for ( var i = 0; i < rows.length; i++ ) {
    sheet.appendRow(rows[i]);
  }
}
Run the test function again, it should append another two lines to the “Raw” tab.
Receiving POST data
Let’s now expose this function to the web. Google scripts accept two special functions that handle GET and POST HTTP requests: doGet and doPost, respectively. These functions take a single argument of type Event (which we will get to), and must return a special object from the ContentService or HtmlService. To explore the API, we’ll first make a function that responds to POST requests by returning the contents of the Event object in JSON format. Add the following code to the script editor:
function doPost(e) {
  var params = JSON.stringify(e);
  return ContentService.createTextOutput(params);
}
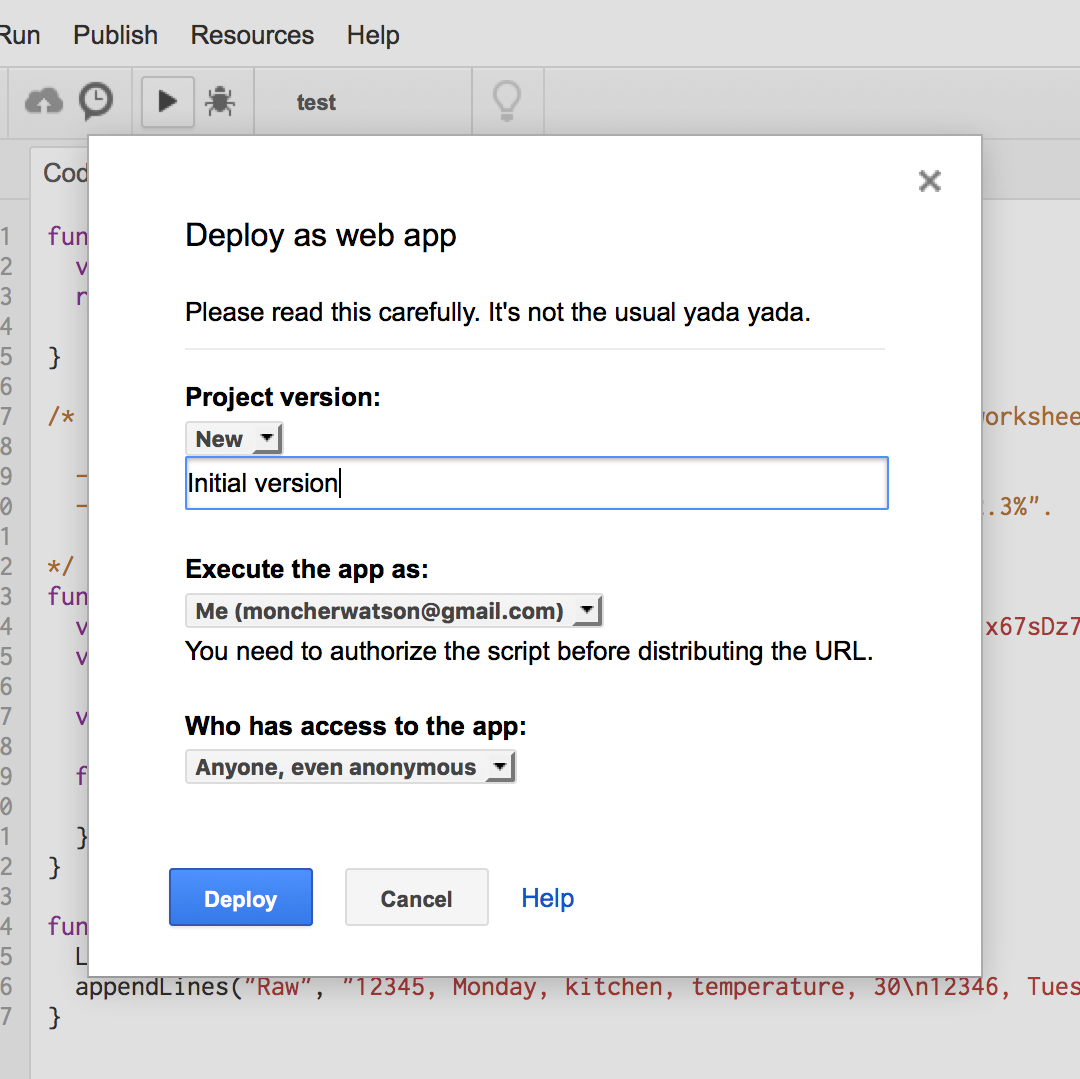
Now publish it with “Publish” > “Deploy as web app…”. Give the version a brief description, ask to execute it as yourself, and allow anonymous access, so that you can post to the spreadsheet without authentication, then deploy:
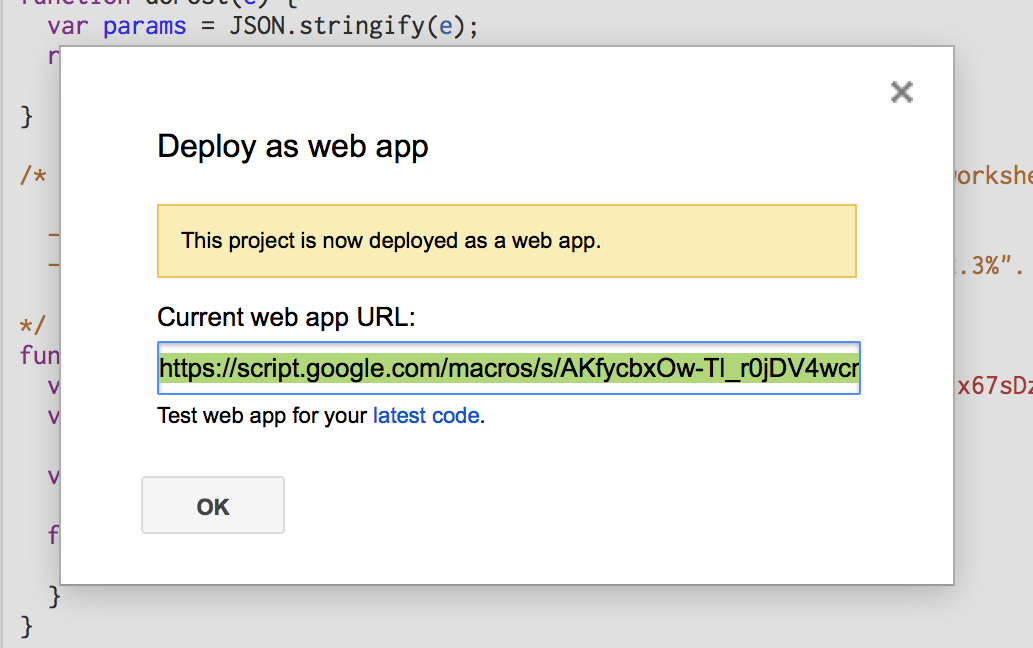
Copy the URL:
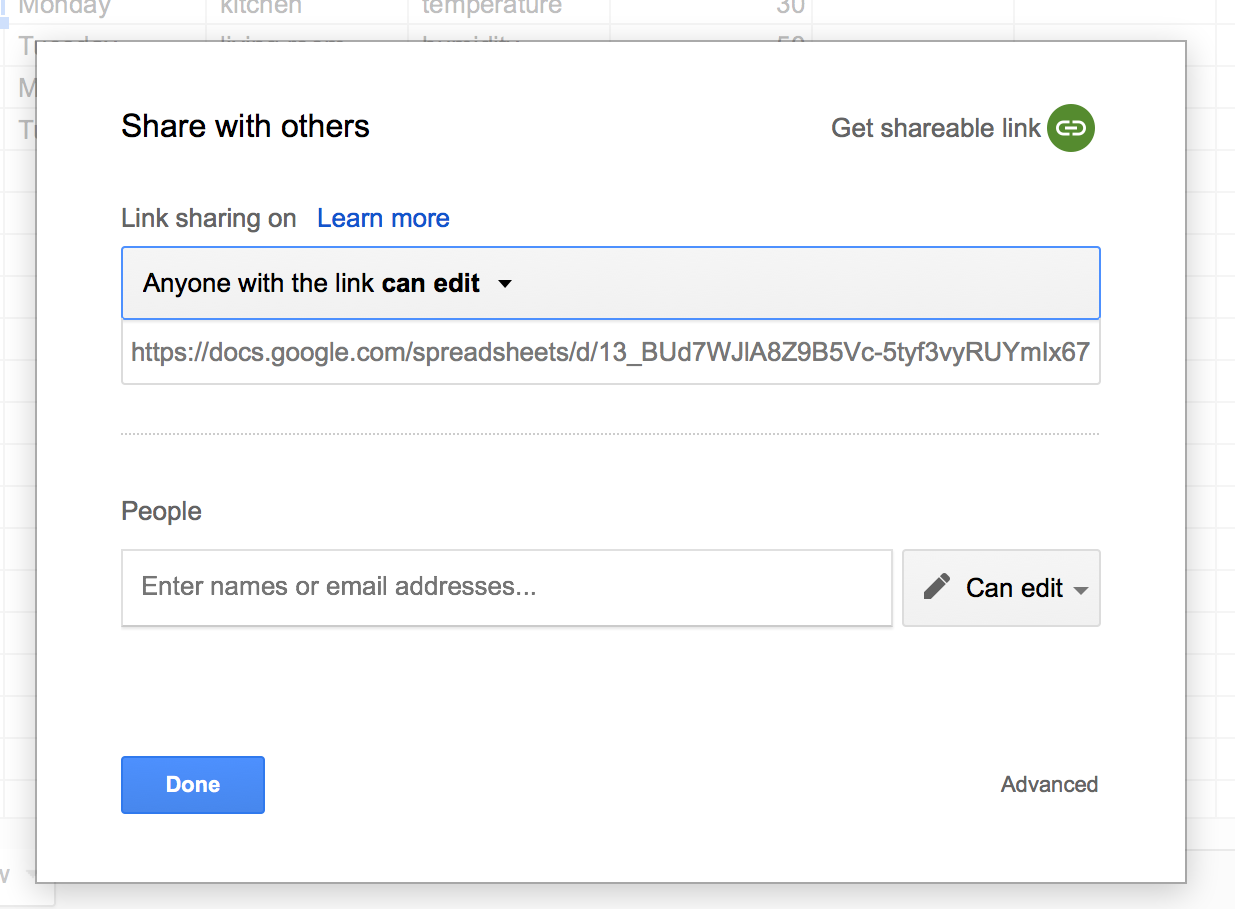
There’s one last thing you need to do before sending HTTP requests to this new web server. Share the spreadsheet publicly. Return to the spreadsheet tab, and open “File” > “Share…”. Click “Get shareable link”, and allow anyone with the link to edit:
Now, fire up your favourite HTTP client (the Postman Chrome extension is a great graphical tool). I’ll be using CURL, from the console. Send a first POST request to the URL you copied above. If using CURL make sure to add the -L option to follow redirects, and the --data option to make a POST request. For my URL, I get:
$ curl --data "hello, world" "https://script.google.com/macros/s/AKfycbxOw-Tl_r0jDV4wcnixdYdUjcNipSzgufiezRKr28Q5OAN50cIP/exec"

{"parameter":{"hello, world":""},"contextPath":"","contentLength":12,"queryString":null,"parameters":{"hello, world":[""]},"postData":{"length":12,"type":"application/x-www-form-urlencoded","contents":"hello, world","name":"postData"}}%
My POST request received some JSON as response. This JSON shows us the structure of the e argument passed to doPost. You’ll recognize the “hello, world” POST data stored in e["postData"]["contents"].
We can use the URL to pass arguments to doPost. Repeat the same request, but append ?sheet=Raw to the URL (make sure the URL is quoted):
$ curl -L --data "hello, world" "https://script.google.com/macros/s/AKfycbxOw-Tl_r0jDV4wcnixdYdUjcNipSzgufiezRKr28Q5OAN50cIP/exec?sheet=Raw"

{"parameter":{"sheet":"Raw","hello, world":""},"contextPath":"","contentLength":12,"queryString":"sheet=Raw","parameters":{"sheet":["Raw"],"hello, world":[""]},"postData":{"length":12,"type":"application/x-www-form-urlencoded","contents":"hello, world","name":"postData"}}%
The URL parameter appeared as e["parameter"]["sheet"].
Now that we understand the structure of the event object, we can modify doPost to:
- Look for a “sheet” argument in the URL
- Extract CSV data from the POST request payload
- Append all lines in the CSV data to the designated sheet.
function doPost(e) {
  var contents = e.postData.contents;
  var sheetName = e.parameter['sheet'];

  // Append to spreadsheet
  appendLines(sheetName, contents);

  var params = JSON.stringify(e);
  return ContentService.createTextOutput(params);

}
Publish a new version of the app (“Publish” > “Deploy as web app…”, set “Project Version” to “new”, describe it, and click “update”). You can now append lines to the spreadsheet through an HTTP Post request! Rerun the last curl command, and observe the newest line added to your spreadsheet:
Clear the spreadsheet now: delete all rows except for the header.
- More on
doGetanddoPost: https://developers.google.com/apps-script/guides/web - More on Event objects: https://developers.google.com/apps-script/guides/triggers/events
Uploading data from python
In practice, you’ll be uploading data using POST requests from the language of choice of your IOT platform. To generate data for this tutorial, I used a python script which creates some random humidity and temperature data for two rooms, in one hour intervals, and uploads them to the spreadsheet. Feel free to skip this section; if you wish to follow the last part of the tutorial, you may also generate data by hand or with other tools.
import time
import datetime
import random
import requests

URL = 'https://script.google.com/macros/s/AKfycbxOw-Tl_r0jDV4wcnixdYdUjcNipSzgufiezRKr28Q5OAN50cIP/exec'

def gdoc_post(data):
    csv = "\n".join(
        ",".join(str(it) for it in line) for line in data
    )

    requests.post(URL + "?sheet=Raw", csv)

def make_temperature():
    return random.randrange(230, 250) / 10.

def make_humidity():
    return random.randrange(400, 500) / 10.

if __name__ == '__main__':
    now = time.time()
    for i in xrange(60):
        timestamp = now + 60 * 60 * i
        date = datetime.datetime.fromtimestamp(timestamp)

        data = [
            [timestamp, date, 'kitchen', 'temperature', make_temperature()],
            [timestamp, date, 'kitchen', 'humidity', make_humidity()],
            [timestamp, date, 'bedroom', 'temperature', make_temperature()],
            [timestamp, date, 'bedroom', 'humidity', make_humidity()],
        ]

        gdoc_post(data)
To run this example, you’ll need the Python language and the requests library. Python should be installed by default on most Linux distributions and OS X. On Windows, I recommend installing the Anaconda distribution, or Python (x, y). Install requests with easy_install (or pip if you have it):
easy_install requests
Now, replace the URL in the code above with your web app URL, save it as uploads.py, and run:
python uploads.py
Return to the spreadsheet. You should see the lines appearing as the script sends them:
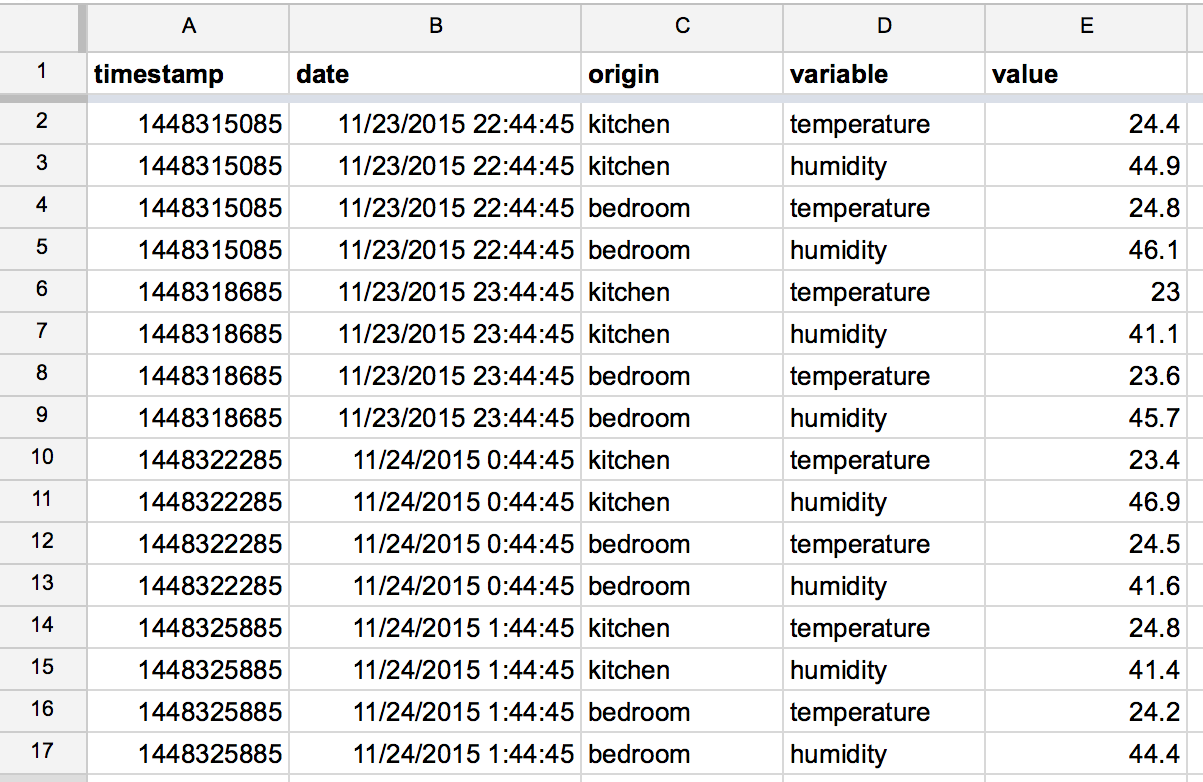
Analytics within the spreadsheet
Before we move on to exporting the data, let’s play with the built-in analytical capabilities of the spreadsheet: we can apply simple filters to the data, extract information with pivot tables, and display it with various charts. Being a web-based application, Sheets even allows those charts to be embedded on web pages directly.
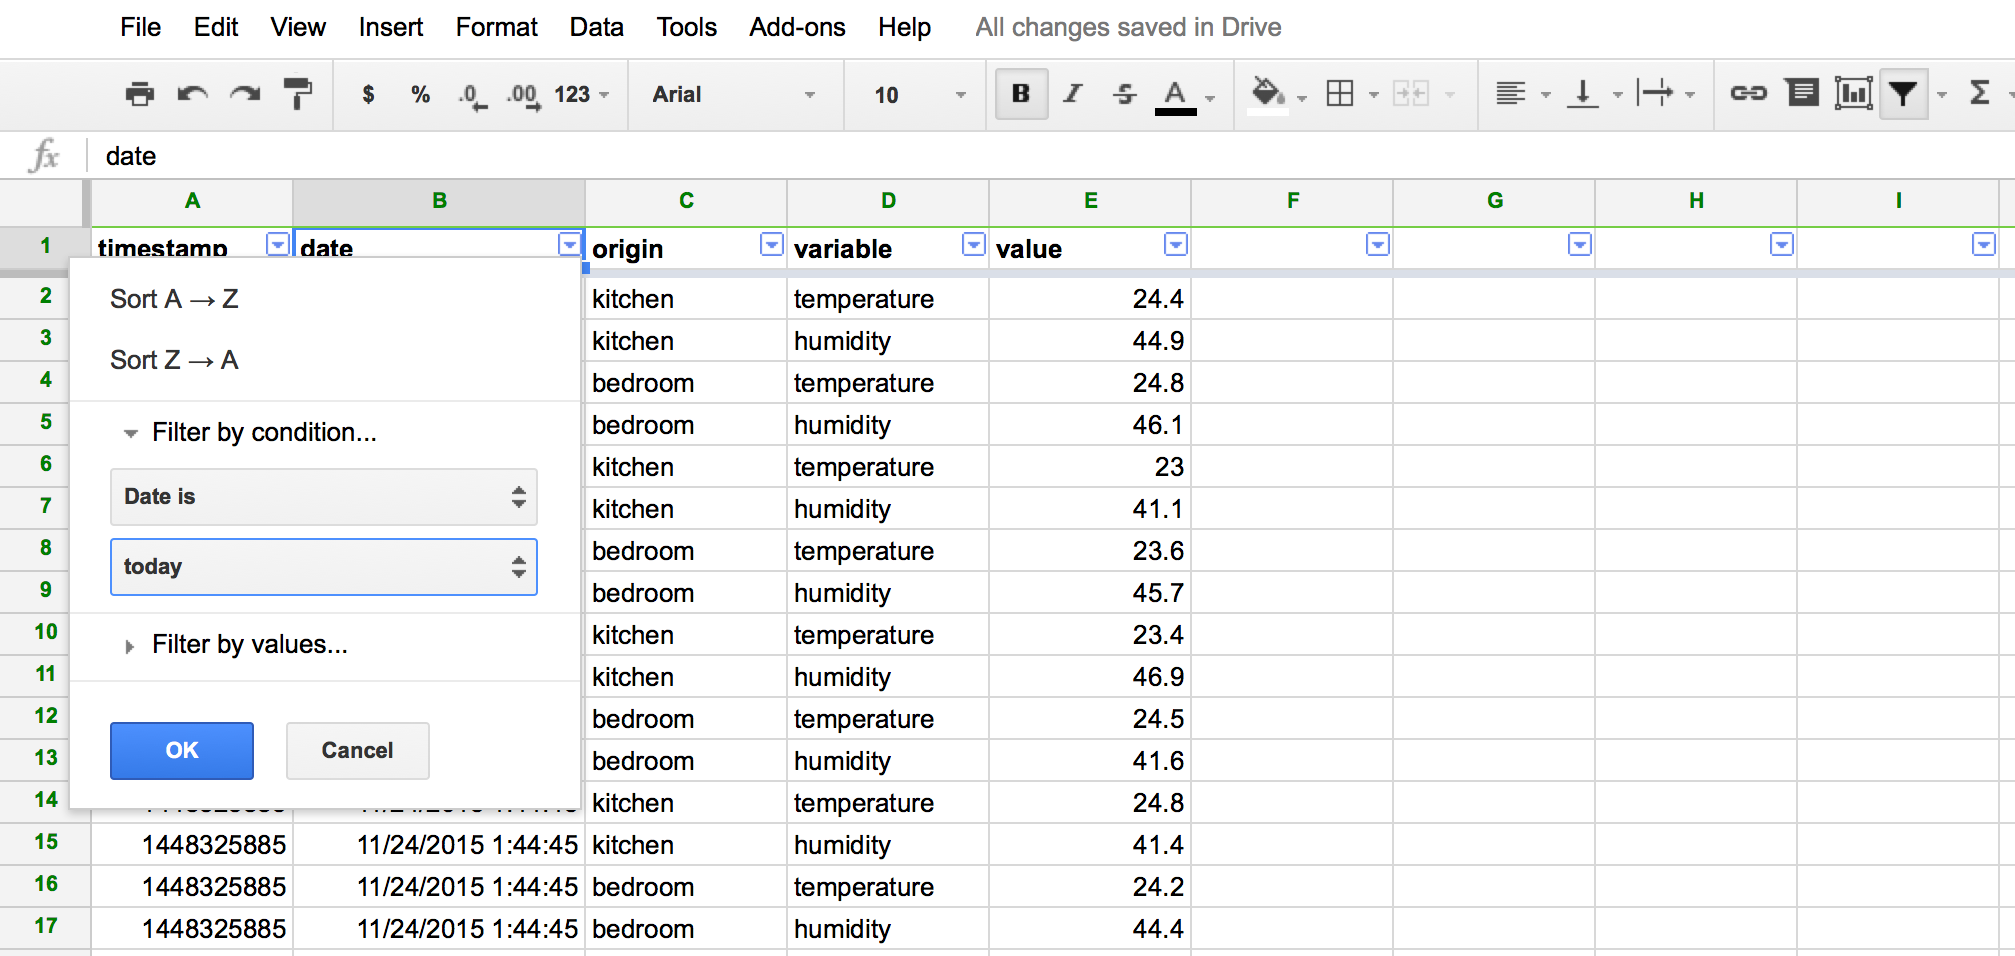
Filters
Filters allow you to show or hide rows of data based on one or several criteria. They are ridiculously simple to use: select the columns you want to filter, then click the funnel symbol in the toolbar. Little arrow icons appear next to each column header. Clicking these pops down a menu from which you can choose filtering criteria. Try restricting the data to only today’s data or only temperature measurements.
Pivot tables
Pivot tables transform long-format data into wide-format data. Select columns A:G, by clicking the A letter above the header row and dragging to the G letter. Go to the “Data” > “Pivot table” menu option. This opens a new blank sheet with a right-hand-side menu to configure the pivot table. Select the “date” column for rows, “origin” for the columns, and “value” for the values – summarize by AVERAGE for the totals to make sense. Finally, filter by “variable”, showing only “temperature”. Your configuration and pivot table should look similar to the screenshot below:
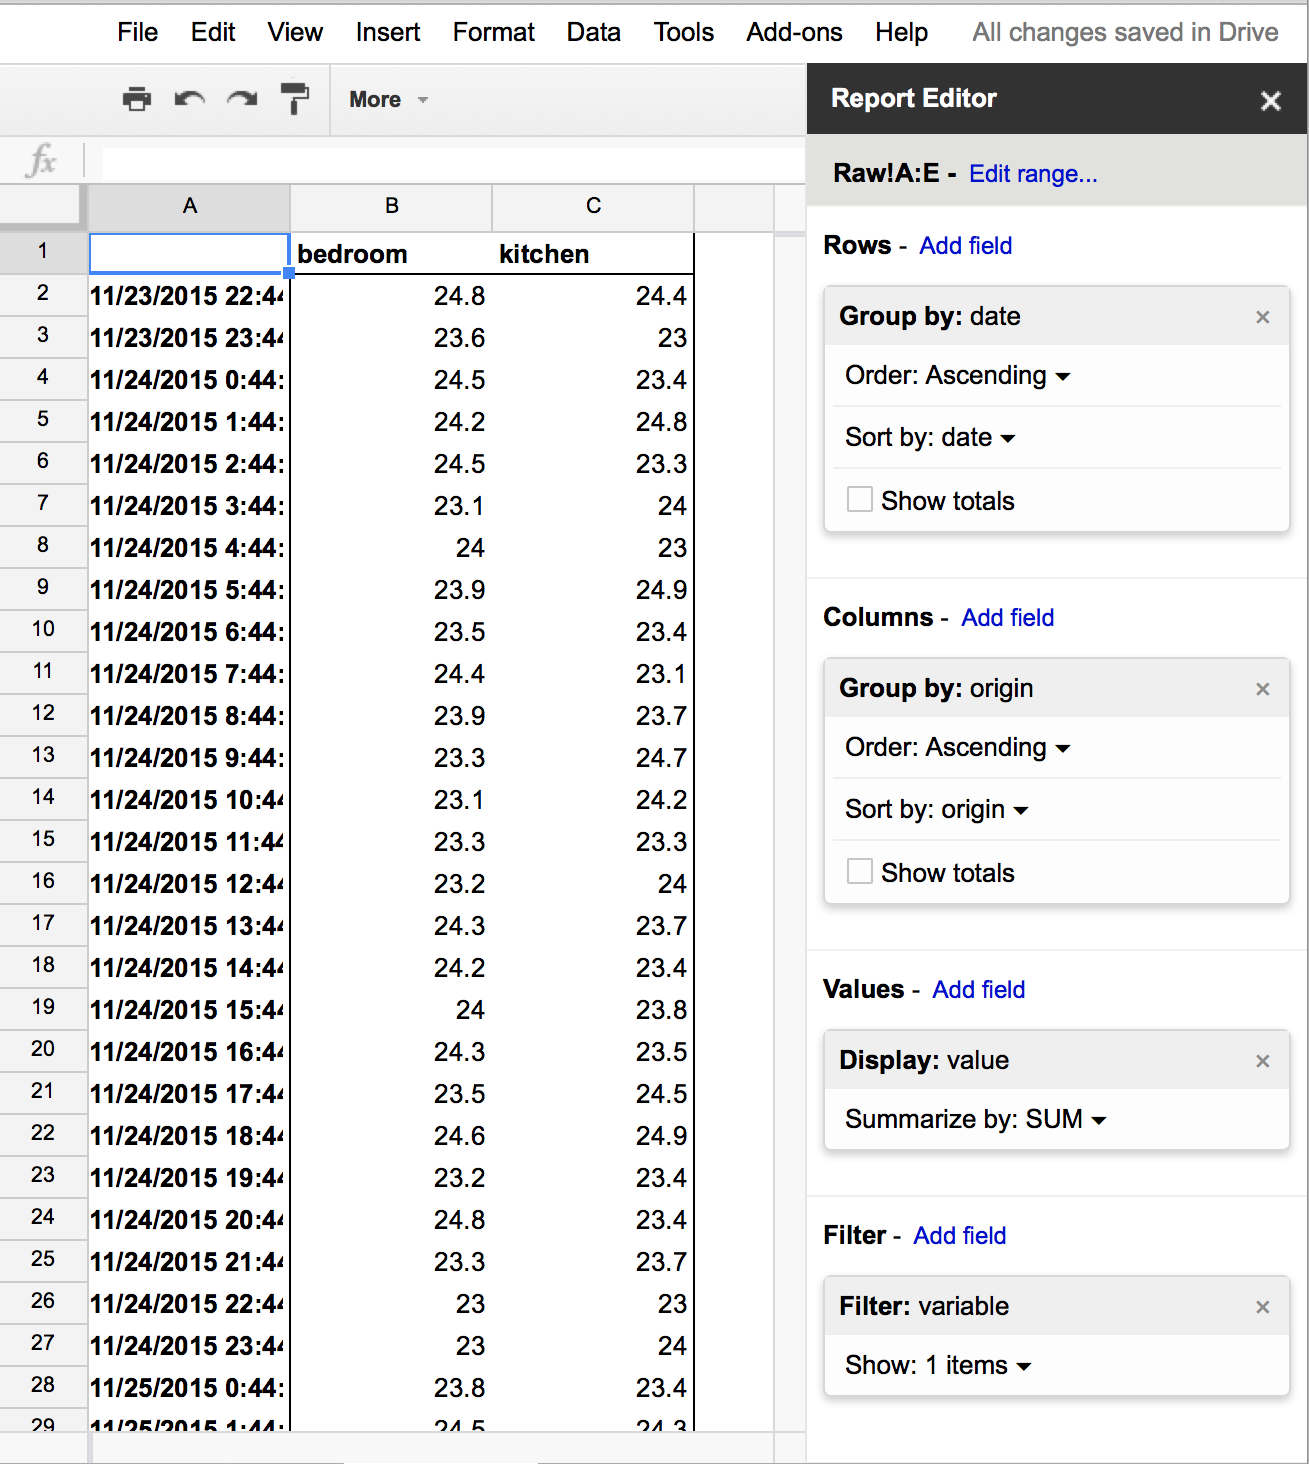
You now have a table that extracts only temperature data and presents them by room. If you kept the “show totals” option checked, you’ll also have an average temperature at each point in time, and an average per room. Note that it updates live, as soon as new data arrives!
As an exercise, try making a pivot table that displays, for each room, the average, standard deviation, and measurement count for both temperature and humidity.
Graphs
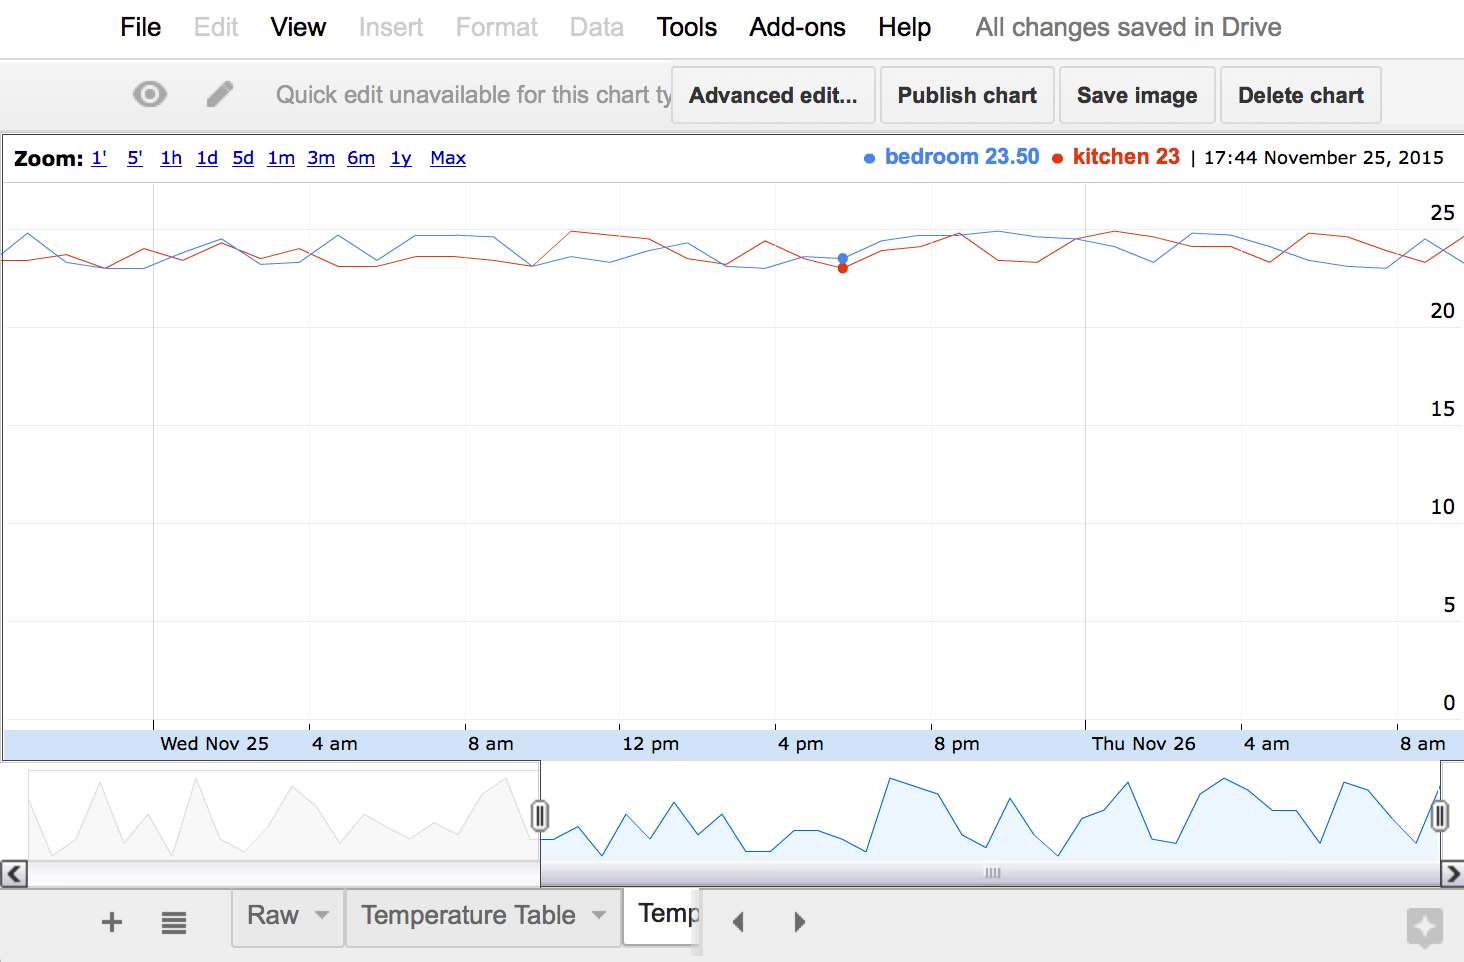
We can make graphs from a pivot table in the usual “spreadsheet” way: select the columns of interest, and click the chart icon on the toolbar. Again, these charts are updated live, as new data is posted to the sheet.
The screenshot below shows a time line chart, moved to its own sheet. This chart can interactively zoom onto date ranges, and is thus ideal to represent time series data from a sensor. You could even embed the chart directly on a web page to make a monitoring dashboard (which could be hosted on google sites, if you are really lazy), using the “Publish chart” option.
GET data in CSV format
The spreadsheet is a powerful analytics tool on its own, but our end goal in this tutorial is to retrieve the sensor data from other tools. We’ll do this by letting GET requests download a sheet in CSV format. To enable this, add a doGet function in the Script Editor (make sure to replace the sheet ID by your own).
function doGet(e) {
  var sheetName = e.parameter['sheet'];

  var ss = SpreadsheetApp.openById('13_BUd7WJlA8Z9B5Vc-5tyf3vyRUYmIx67sDz7ZmyPG4');
  var sheet = ss.getSheetByName(sheetName);
  var data = sheet.getDataRange().getValues();


  // Loop through the data in the range and build a string with the CSV data
  // taken from https://developers.google.com/apps-script/articles/docslist_tutorial#section2
  var csvFile = undefined
  if (data.length > 1) {
    var csv = "";
    for (var row = 0; row < data.length; row++) {
      for (var col = 0; col < data[row].length; col++) {
         if (data[row][col].toString().indexOf(",") != -1) {
           data[row][col] = "\"" + data[row][col] + "\"";
         }
      }

      // Join each row's columns
      // Add a carriage return to end of each row, except for the last one
      if (row < data.length-1) {
        csv += data[row].join(",") + "\r\n";
      }
      else {
        csv += data[row];
      }
    }
    csvFile = csv;
  }

  return ContentService.createTextOutput(csvFile);
}
This function is similar to doPost, in reverse: it opens the specified sheet, reads all data in the sheet, then encodes it in CSV format, and finally returns the CSV data. The scripting API doesn’t include a CSV encoding function, so instead we re-used a procedure shown in the official documentation.
Deploy this new version of the web app. You can now download the data in CSV format! With curl, make sure to add the -L option again, append ?sheet=Raw to the web app URL, and quote the URL:
$ curl -L 'https://script.google.com/macros/s/AKfycbxOw-Tl_r0jDV4wcnixdYdUjcNipSzgufiezRKr28Q5OAN50cIP/exec?sheet=Raw'

timestamp,date,origin,variable,value
1448315085.07,Mon Nov 23 2015 22:44:45 GMT+0100 (CET),kitchen,temperature,24.4
1448315085.07,Mon Nov 23 2015 22:44:45 GMT+0100 (CET),kitchen,humidity,44.9
1448315085.07,Mon Nov 23 2015 22:44:45 GMT+0100 (CET),bedroom,temperature,24.8
1448315085.07,Mon Nov 23 2015 22:44:45 GMT+0100 (CET),bedroom,humidity,46.1
1448318685.07,Mon Nov 23 2015 23:44:45 GMT+0100 (CET),kitchen,temperature,23
1448318685.07,Mon Nov 23 2015 23:44:45 GMT+0100 (CET),kitchen,humidity,41.1
1448318685.07,Mon Nov 23 2015 23:44:45 GMT+0100 (CET),bedroom,temperature,23.6
1448318685.07,Mon Nov 23 2015 23:44:45 GMT+0100 (CET),bedroom,humidity,45.7
...
If you have a single sheet to export, you could also experiment with the “Publish to the web” function of Spreadsheets. In my own application, I needed access to several sheets, so I created my own export function.